
Page 55 - FINAT Yearbook 2019
P. 55
first quarter of 2019 appeared to indicate a rebound, with self-adhesive roll labelstock demand increasing by 4.2% compared to the first quarter of 2018.
Going beyond self-adhesive, it is interesting to note that 35% of the respondents indicated that they are currently already active in the area of flexible packaging. Also shrink sleeves and wraparound labels are part of the product portfolio of more than 25% of label printers’ portfolio. And the interest to diversify into other areas continues to grow, especially in areas like pouches and linerless labels.
ASSESSMENT TOOL
FINAT President Chris Ellison explains his appreciation of the RADAR: “One of the crucial elements for business development is the availability of up to date market information, and as we saw in Copenhagen during the European Label Forum, after successive years of above average growth since the early years of the decade, we are facing economic uncertainty that is resulting in a slowdown. The RADAR reports prove an invaluable tool for our members to assess the specifics by region and vertical market segment, from the label converter perspective.”
For the first time, there is also a section to check the status of recycling inside our industry. Mr. Ellison continues: “As we saw during roundtables with label converters at the ELF, sustainability and recycling are at top of label business leaders’ agendas. The issues at stake (raising awareness through education and lobby, organizing the logistics and making sure that collection and recycling solutions become technically and commercially viable), are beyond the scope of individual companies and requires a collective approach involving all stakeholders.”
The FINAT RADAR is available free of charge for downloading from www.FINAT.com
FINAT’s latest edition of the 6-monthly market monitor, the FINAT RADAR, confirms signs of a cooling label market.
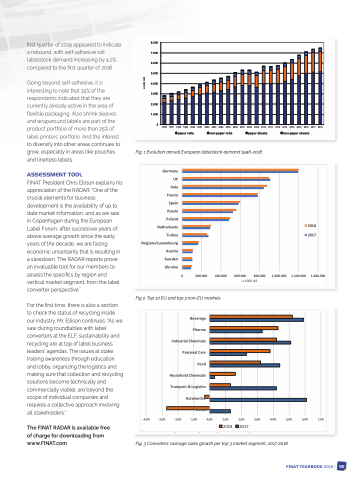
Last year’s consumption of self-adhesive label materials in Europe amounted to a total of just under 7.5 billion square meters, an increase of 1.4% on 2017. 2018 thus continued the signs of slowdown that became evident in the course of 2017, when the market grew by 4.7%, below the average 5% plus annual growth rates that had been recorded since the bottom of the last recession in 2011.
8.000 7.000 6.000 5.000 4.000 3.000 2.000 1.000
0
1996 1997 1998 1999 2000 2001 2002 2003 2004 2005 2006 2007 2008 2009 2010 2011 2012 2013 2014 2015 2016 2017 2018
paper rolls non-paper rolls paper sheets non-paper sheets
Fig. 1 Evolution annual European labelstock demand 1996-2018
FigM. i1xEevdoplui ctitounr eannual European labelstock demand 1996-2018
For the first time since the beginning of the decade, there was a mixed picture of label volume demand growth rates across Europe. Whilst leading markets like Germany and France recorded modest growth rates below
0.5%, several southern and eastern EU markets continued to achieve above average growth rates between
UK
and 4.5% respectively, although towards the end of 2018 and beginning of 2019, the was a pre-Brexit stocking
x mln m2
Germany
2.5% and 4%, while emerging markets in Russia and Ukraine recorded strong growth numbers in excess of 6%. By contrast, at opposite ends of the continent. The UK and Turkey recorded negative growth of more than 1%
Italy
effect in the UK leading to a rebound of labelstock demand.
France Spain Russia Poland Netherlands Turkey Belgium/Luxembourg Austria S we d e n Ukraine
2018 2017
1.400.000
Fig 2. Top 10 EU and top 3 non-EU markets Fig 2. Top 10 EU and top 3 non-EU markets
Healthy underlying factors
0
200.000
400.000
600.000
800.000
1.000.000
1.200.000
Given the strong historic correlation of labelstock demand and GDP development, the slowdown of the label
industry is a significant indicator of economic uncertainty, after years of macro-economic recovery.
Nevertheless, the prospects for the self-adhesive labels and narrow-web packaging industry remain healthy. In
FINAT RADAR 11 highlights
Industrial Chemicals
Beverage
the past two decades, the European self-adhesive label market grew by a factor 2.5, led by the continuous maturing of label markets in eastern Europe, and by innovations in variable information printing technology and high quality product decoraPthioanr.mEastern Europe now accounts for almost one quarter of the European label market (almost a doubling of its market share in 15 years), whilst high-end filmic label materials are approaching the 30% benchmark of total label materials demand in Europe.
Personal Care
Edition 11 of the FINAT RADAR was based on a survey carried out among 80 label converters across the different regions in Europe. The results from the survey reflect the above picture, as year over year sales
Food
(with the exception of industrial chemicals). For the first time since start of FINAT Radar, there were declines in
some of the segments. Feedback from converters also shows that companies are exercising more caution in
growth is down in most regions, and with 4.9% was the lowest since the survey’s base year 2013. There was also a remarkable shift between 2017 and 2018 in growth rates per top 3 end-use segment. While 2017 was
Household Chemicals
the year of 'non-prime’ (VIP) label growth, 2018 showed a stronger performance in the prime labelling sectors
Transport & Logistics
2019, with only 10-15% of participating converters planning to purchase a conventional or digital press this
year. Capital equipment purchasing projections are markedly higher for 2020, in case of continued
Automotive
unfavourable domestic and export economic conditions, converter caution may extend into the foreseeable future. Looking at the short term however, the first quarter of 2019 appeared to indicate a rebound, with self-
7,0%
Retail
adhesive roll labelstock demand increasing by 4.2% compared to the first quarter of 2018.
-4,0% -3,0% -2,0% -1,0% 0,0% 1,0% 2,0% 3,0% 4,0% 5,0% 6,0%
Going beyond self-adhesive, it is interesting to note that 35% of the respondents indicated that they are currently already active in the area of flexible pack2a0g1in8g. Als2o0s1h7rink sleeves and wraparound labels are part of
the product portfolio of more than 25% of label printers’ portfolio. And the interest to diversify into other
Fig. 3 Converters’ average sales growth per top 3 market segment, 2017-2018 areas continues to grow, especially in areas like pouches and linerless labels.
Fig. 3 Converters’ average sales growth per top 3 market segment, 2017-2018
Assessment tool
FINAT President Chris Ellison explains his appreciation of the RADAR: “One of the crucial elements for business
development is the availability of up to date market information, and as we saw in Copenhagen during the
European Label Forum, after successive years of above average growth since the early years of the decade, we
are facing economic uncertainty that is resulting in a slowdown. The RADAR reports prove an invaluable tool
FINAT YEARBOOK 2019 | 55 for our members to assess the specifics by region and vertical market segment, from the label converter
perspective.”
x 1000 m2
